 The following article was written Prof Ray Hilborn (School of Aquatic and Fishery Sciences, University of Washington)
Since 2007 an international team of scientists, including academics, fisheries agency staff and NGO staff, have been compiling data on the status of fish stocks around the world. At present this data base includes over 1,200 individual fish stocks constituting roughly ½ of the worlds landings. The major gaps in the data base are the large fisheries of S. and SE Asia, including China, India, Indonesia, Thailand, Korea, Taiwan, Malaysia and Viet Nam. Europe, North Africa, the Mediterranean and Black Sea, the Americas, South Africa, Australia and New Zealand are well covered. This data base is available at www.ramlegacy.org.
We classify forage fish as a wide range of small pelagic fishes in the taxonomic groups clupeiformes (herrings, sardines, menhaden pilchards, sprat, land anchovy) and the mackerels and a few other species including sand eel, smelt, saury, and eulachon. Our database contains information on the status of 137 of these stocks constituting an average annual catch of over 22 million tons. FAO reports global catch of forage fish is in the range of 22 million tons, so we can speak with confidence about the status of most of the forage fish. What is missing are several million tons of forage fish stocks of SE Asia.
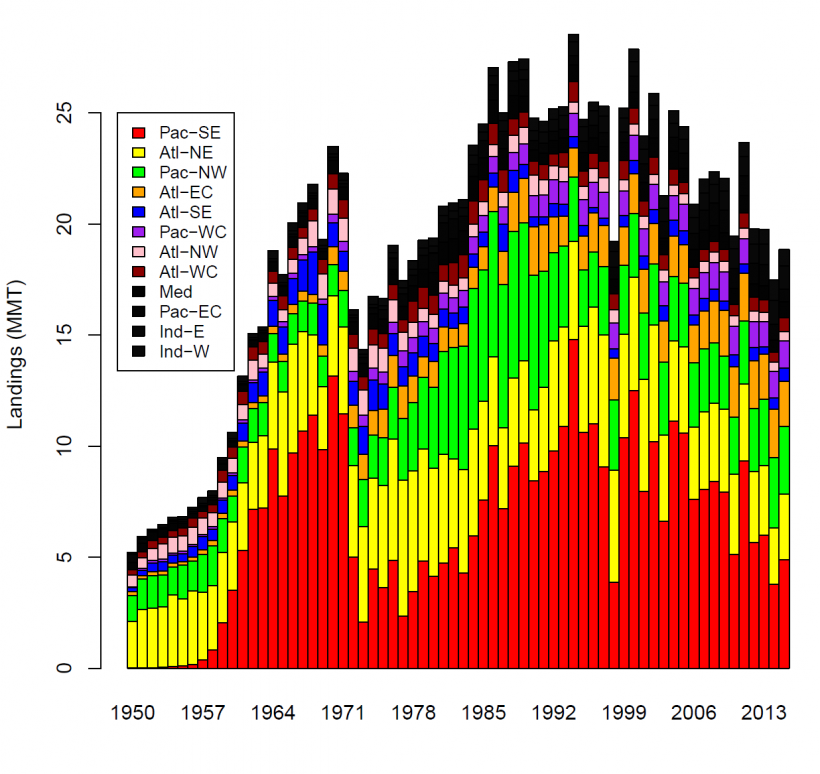
The figure below shows the total catch of forage fish from the FAO catch data.

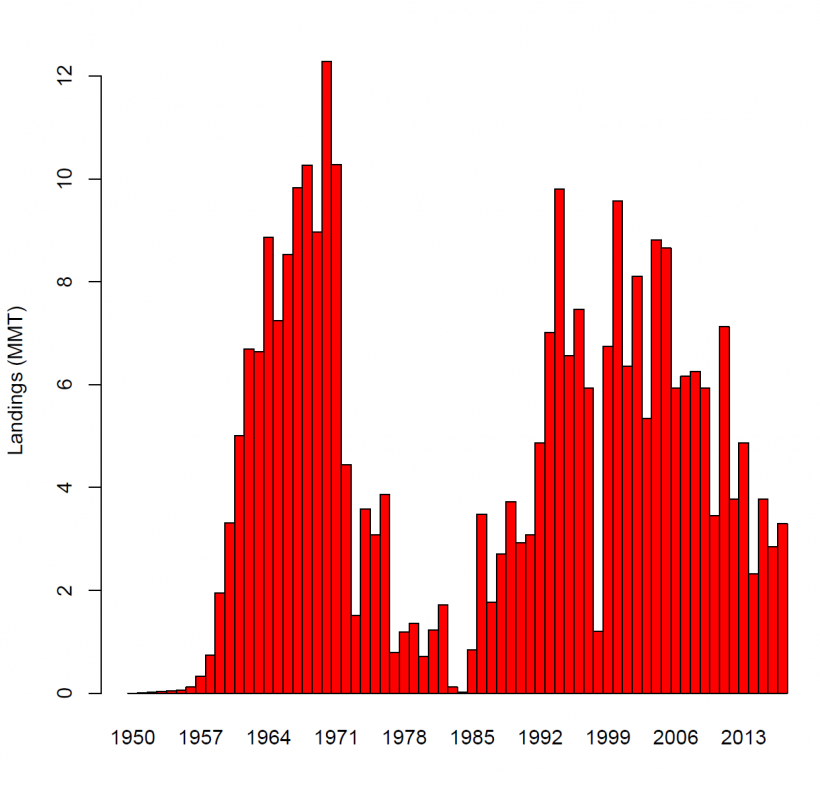
The largest forage fish stock is the Peruvian anchoveta catch from Peru, and its catch is shown below

Forage fish stocks are typically managed around the world by adjusting fishing pressure to achieve long term maximum sustainable yield (MSY). The figure below shows our estimate of the average fishing pressure, scaled relative to the level that would produce MSY. Under perfect management the orange line would be right at 1.0; that is the average fishing pressure was right at the level that would produce MSY.
As you can see up to about 2000, fishing pressure was slightly higher than 1, but since about 2005 it has been below 1 and declining. This shows that on average fishing pressure is now lower than would produce long term maximum yield and seems to continue to decline as fisheries agencies become more cautious in their management.

We can also look at the abundance of the forage fish stocks in the figure below. In this figure being above 1.0 implies stocks are more abundant than would produce maximum sustainable yield.

If we follow the orange line we see that forage fish stocks have been slightly above or at the level that would produce maximum sustainable yield.
These figures show averages, and in any year would expect half the stocks to be above the average, and half below. In the US a stock is classified as overfished if its abundance is less than ½ the level that would produce MSY. 46% of forage fish stocks in our database are below this level and these constitute about 20% of average catch.
Forage fish are known to fluctuate dramatically regardless of the fisheries management system, and thus analysis suggests that fisheries management for forage fish has been effective at maintaining close to maximum yield.
FAO Figures from directory Hilborn Forage Fish Analysis


