Life Cycle Assessment (LCA) provides a comprehensive assessment of the full (global) impact of food-production and avoid trade-offs or cross-subsidisations of sectors through incomplete sustainability accounting (find out more about the Evolution of Sustainability Metrics for the Marine Ingredient Sector.
In short:
- ALL ingredients have a footprint.
- The environmental credentials “space” is about to become significantly more regulated.
- We need objectivity: you cannot manage, what you cannot measure: LCA is the best path forward
- All ingredients in the supply-chain need to engage using the SAME rules and frameworks.
- The process has much more complexity than most perceive: there are clear rules about how we must apply the LCA process.
- Impacts can vary both at sourcing and processing, and system boundaries do matter.
- When combining the low carbon aspect of marine ingredient production with the “circular” protein strategy, the environmental footprint of marine ingredients is lower than the majority of ingredients, with low CO2 discharge, low energy use, and little to no reliance land or freshwater, and superb nutritional properties.
Summary
The application of lifecycle assessment analyses has been developed to address the limitations of the other sustainability metrics and to create more holistic approach with traceability across the value chain and greater cross sector harmonisation. There are international standards that are used to underpin how these LCA need to be done, with additional rules imposed on feed ingredients. This ensures that everyone making sustainability claims based on LCA is using the same approach and therefore the information has greater utility and value.
|
Find out more about the Evolution of Sustainability Metrics for marine ingredients here |
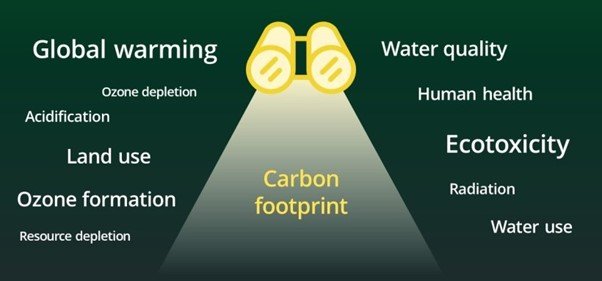
The application of LCA is a far more complex calculation than those of single-point metrics, and analyses take into account a wide variety of environmental impact categories, such as global warming potential (carbon footprint), ozone depletion potential, consumptive water use; and land use, among others. To assess these impacts, the analyses do not just cover the production units but also cover both upstream and downstream impacts and processing, through to distribution, consumption and waste disposal. Each of these different units are called systems and each are mapped separately and then linked by a common (flow) unit. All these systems use land, water, raw materials and energy, and invariably have impacts that can lead to harmful emissions. How far up and downstream an LCA goes is agreed by methodology defined by the European PEFCR-Feed and GFLI.
You Cannot Manage, What You Cannot Measure
Metrics are simply a basis for establishing relevant goals and measuring progress against them. This allows then you to demonstrate impact, effectiveness, and value against those goals. In effect, you cannot manage something if you cannot measure it. For something to be used to allow for functional trade-offs and choices a measurement system that accommodates a variety of options is most valuable. To do this a universal assessment framework is required.
An LCA approach to sustainable development aims to compare the full range of environmental effects assignable to defined products and services by quantifying all the inputs and outputs associated with various material and energy flows and assessing how these flows affect the environment.
In short, it requires data collection associated with:
- Inputs (resource use) / Outputs (emissions)
- Designated material flows
- Assigned environmental costs
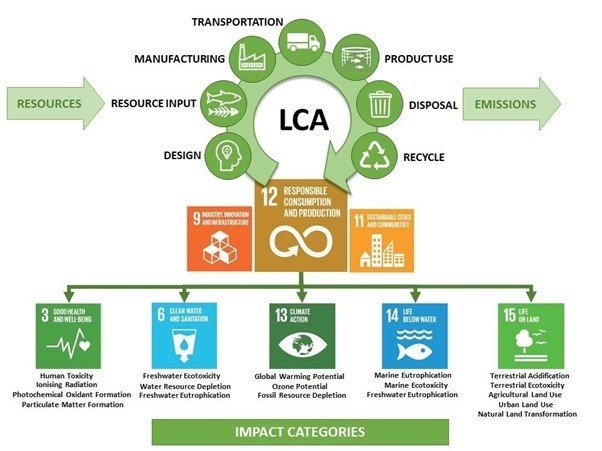
Figure 2. Linkage between LCA analysis, Sustainable Development Goals and LCA Impact Categories.
To achieve this the compilation of an inventory of relevant energy and material inputs and environmental releases is required. This then allows an evaluation of the potential environmental impacts associated with each of the identified inputs and releases. Part of this process is the characterisation of emissions; whereby different emissions are standardised into equivalents.
For example, in terms of global warming potential (GWP), which is measured in carbon dioxide (CO2) equivalents, one unit of CO2 = 1 equivalent, whereas methane (CH4) has 25x the CO2 equivalent in terms of GWP. Another of the important considerations of LCA is the observation that environmental impacts do not just occur on the unit of production. Impacts can occur throughout the value-chain from raw material extraction (capture), to processing, distribution, consumption and of course at the point of waste disposal (or recycling). Each of these stages requires land, water, raw materials, and energy, and each can contribute to emissions of some kind or other. Another aspect to the LCA story, is that it is not constrained to just carbon footprint, with up to 18 different environmental impacts now being assessable.
Importantly, LCA is increasingly seen as the “mainstream” way to establish environmental credentials. The process of undertaking an LCA analysis though requires lots of planning, data, and interpretation of that data. Because of these constraints, there have been various attempts to set some standards on this; the International Standardisation Organisation (ISO) initiated this (ISO 14040 series), the EU have also taken a lead with the Product Environmental Footprint Categorisation Rules (PEFCR) approach and more recently the Global Feed Lifecyle-Assessment Institute (GFLI) was established to be an independent repository with freely available database and tools. This independent repository has a standardised database and tools and (v2.0) has close to 1500 ingredients (as of December 2024).
Equitable Comparisons
It has become clear that aquaculture is now making a strategic use of marine ingredients, leveraging the high-nutrient density and palatability stimulating characteristics of those ingredients to underpin the global production of more than 45 million tonnes of feed in 2020, and exceeding more than 50 million tonnes in the present day (Figure 3).
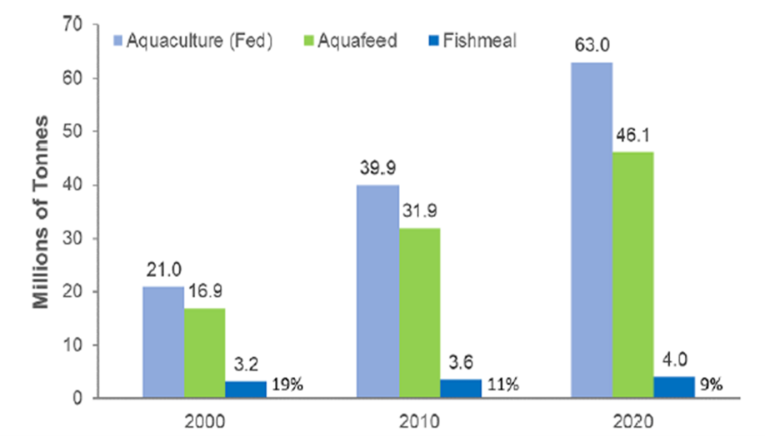
Figure 3. Global fed aquaculture production, aquafeed production and fishmeal use from 2000 to 2020. From: Glencross et al., (2024). Reviews in Fisheries Science and Aquaculture, DOI:10.1080/23308249.2024.2315049.
Finding additional ingredients to provide bulk nutrients into the future is a clear and growing need. An analysis of feed formulations across a range of species shows that plant proteins and oils are now providing the bulk of the nutrients in most aquaculture feeds, and this is likely to remain the case for some time. However, recent studies have shown that this use of plant resources worsens the environmental footprint of aquaculture more than that encountered when using marine ingredients. Underpinning that assertion about what is more sustainable has been the advent of LCA sciences, which allows a more holistic examination of the sustainability story. It provides the capacity to compare every ingredient we use and on a basis of a more equitable comparison, which then means we can more effectively formulate diets to sustainability targets.
|
Find out more: A SWOT Analysis of the Use of Marine, Grain, Terrestrial-Animal and Novel Protein Ingredients in Aquaculture Feed |
What are the options for feed with the least environmental impacts?
When examining ingredients using an LCA approach, among the various alternative proteins and oils currently being used and/or considered we see substantia variability in their footprints. Those ingredients that through their production typically have a high demand for energy, also have a higher CO2 footprint. Other ingredients and use substantially more land and freshwater, than other ingredients. It appears that all ingredients have a “weak spot”.
The carbon cost of an ingredient as an additional use criterion in feed formulation is increasingly being considered. This would transfer additional costs to the higher carbon footprint ingredients, while at the same time encouraging the use of those ingredients with a low carbon footprint. This allows the monetisation of that point-of-difference to further encourage production of the low carbon footprint ingredients. This whole issue of sustainability and carbon footprint is going to become increasingly highlighted and sooner or later the carbon-cost will become part of the cost paid.
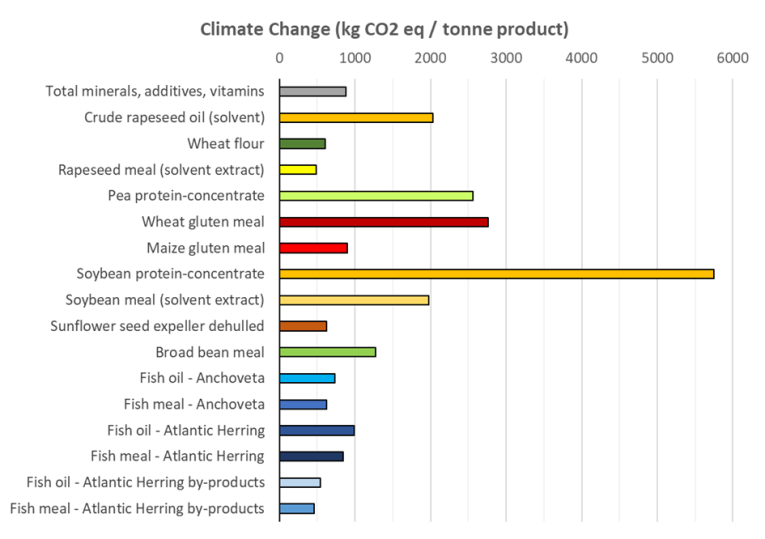
Figure 4. Global Feed Lifecycle Assessment Institute (GFLI.org) v2.0 data [all values are EF3.1 RER sourcing, economic allocation basis] of a suite of common ingredients used in the production of aquaculture feeds in northern Europe.
Responding to the growing demand for protein, there has been a boom in new enterprises promoting insects, single-cell proteins, and microalgae. Notably though the only circular ingredients being used with any scale (>100ktonnes) are the use of fishmeal and oil from trimmings and by-products. Fishmeal and fish oil volumes stabilised at around 6 million metric tonnes (mt) per annum from 2000 onwards (roughly 5 million tonnes fishmeal, 1 million tonne fish oil). In fact, if we combine the low carbon aspect of marine ingredient production with the “circular” protein strategy we take something that has a pretty good environmental footprint already; low CO2 discharge, low energy use, and little to no reliance land or freshwater, and make it into something super special, an ingredient with superb nutritional properties and an even lower carbon footprint.
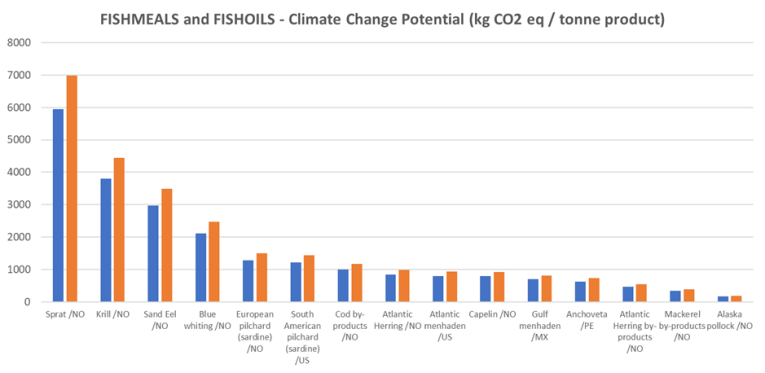
Figure 5. Existing GFLI (v2.0) Marine Ingredients Data. all values are EF3.1 RER sourcing, economic allocation basis]
No Such Thing as Waste
Circular protein strategies for the feed sector are arguably not a new concept, but more of a resurrection of what historically we always used to do, but perhaps now presented through a different lens of an environmental perspective. Indeed, use of resources as animal feed is seen as one of the preferable options in the food/feed source use hierarchy. With a looming shortage of protein resources, the need for an approach with increasing circularity in resource use, coupled with the application of some new novel tech to supply the bulk nutrients, may be what is required to fill that future gap.
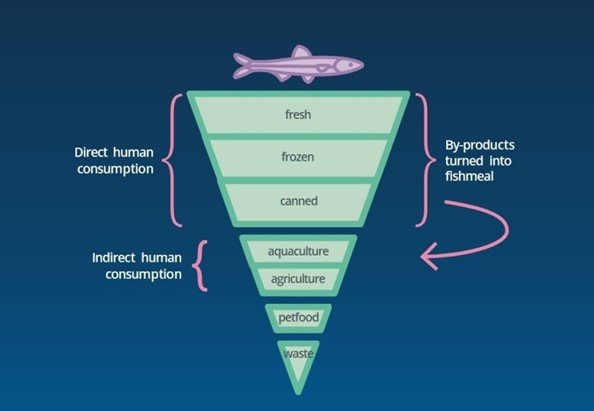
However, the challenge here remains as to how we can effectively implement these technologies at a scale to sustain the rate needed to provide those nutrients AND to deliver this at a cost-point competitive in the marketplace based on their nutrient density.
The benefit of by-products
LCA analyses can be based on mass, energy or economic allocation methods to assess partitioning of products through interconnected systems. In the feed sector it is now mandated that we use economic allocation, with such allocation methods recommended by PEFCR-Feed and GFLI methodologies, though for GFLI the other two allocation methods are still reported. When the primary catch/production of fish is for human consumption, this then means that most of the economic allocation is taken by the food portion, even though that fraction often represents less than 50% of the raw material. This means that the lower-value by-products get attributed an even lower allocation of the environmental footprint (typically it ends up being close to 90:10 split). So, materials that are already low CO2 discharge, low energy use, with little to no reliance land or freshwater, become even less so because 90% of the footprint is attributed to the meat and only 10% to the by-product streams.
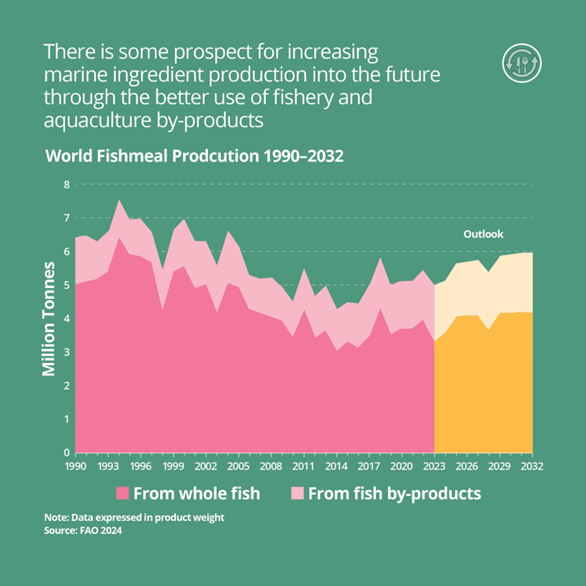
By embracing an LCA approach to assessing marine ingredient sustainability, the industry will ensure that they remain accountable on a more holistic and widely accepted path forward for environmental footprint assessment moving into the future. By embracing the use of circular protein and oil use, the production of marine ingredients is taking a proactive step to being part of building a waste-free world. Together these elements are all part of a proactive approach by the industry to maintain perpetual improvement. Given the increasing use of LCA sciences provides a clear and structured way to assess sustainability credentials, adding in the growing role of by-product use and its ultra-low footprint, it shows why the marine ingredients sector going forward is embracing lifecycle assessment sciences.
Last updated January 2025


